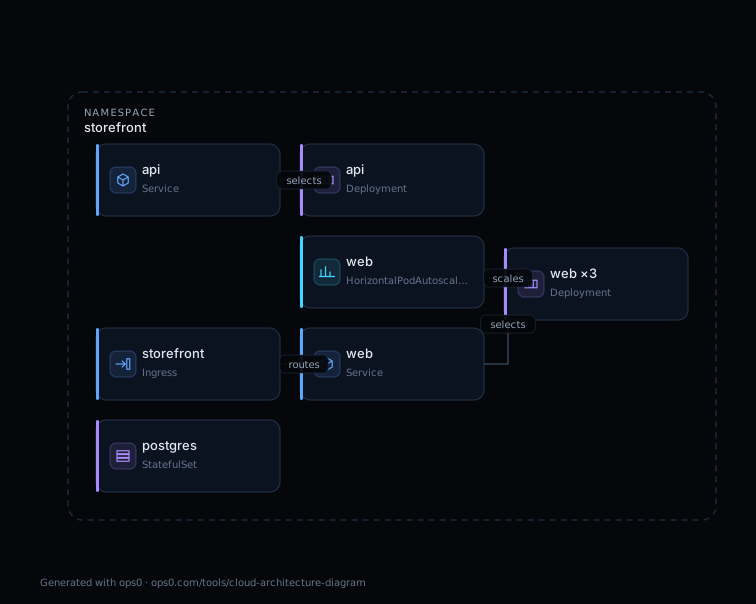
A Kubernetes architecture diagram shows the workloads running in a cluster, the Services and Ingress that route traffic to them, and the namespaces or clusters that group them. The fastest way to get an accurate one is not to draw it: export the manifests for a namespace, paste them into a generator that understands Kubernetes objects, and let the diagram follow the wiring the cluster uses. The whole process takes about a minute, and the result can be regenerated every time the manifests change.
This guide covers which manifests to export, how a generator derives connections from them, what a diagram built from YAML can and cannot tell you, and how the main approaches compare. The worked example uses the free ops0 diagram generator, which runs in the browser and never uploads your files, but the method applies to any tool that reads manifests.
What a Kubernetes architecture diagram should show
Most hand-drawn cluster diagrams show boxes labelled "pods" with arrows that mean nothing in particular. A useful diagram answers four questions an engineer asks during an incident or a review:
- Where does traffic enter? Ingress resources and LoadBalancer Services are the edge. They should be drawn at the boundary, with their backends visible.
- Which Service fronts which workload? A Service selects pods by label, so the diagram should draw an edge from each Service to the Deployment, StatefulSet or DaemonSet whose pod template carries matching labels.
- What scales, and what does not? A HorizontalPodAutoscaler targets one workload. A fixed-replica Deployment with no autoscaler and a single-replica StatefulSet are both worth seeing at a glance.
- What holds state? PersistentVolumeClaims and the StatefulSets that mount them mark the parts of the system that cannot be recreated casually.
Namespaces are the natural grouping for all of this. A diagram per namespace is usually readable; a diagram of a whole multi-tenant cluster rarely is.
Step 1: Export the manifests
The generator needs the objects as YAML. There are three common sources, and the right one depends on how the cluster is deployed.
From a live cluster with kubectl. Ask for the kinds that matter for architecture, scoped to one namespace, as a single multi-document file:
kubectl get namespace,deployment,statefulset,daemonset,service,ingress,horizontalpodautoscaler,persistentvolumeclaim \
  -n storefront -o yaml > storefront.yaml
This is read-only. The output includes status blocks and managedFields metadata that a generator ignores, so there is no need to clean it. If you want a smaller file, add --show-managed-fields=false.
From a Helm chart. helm template renders a chart to plain manifests without installing anything, so you can diagram a release before it exists or diagram exactly what a given values file would produce:
helm template storefront ./charts/storefront -f values-prod.yaml > storefront.yaml
From Kustomize. kubectl kustomize overlays/prod > storefront.yaml (or kustomize build) renders an overlay the same way.
The Helm and Kustomize routes have one advantage over kubectl get: they show intent. The live-cluster route shows what is running, including anything applied by hand that never made it into Git. Diagramming both and comparing them is a quick drift check.
Step 2: Generate the diagram
Paste the YAML, or drop the file, into the cloud architecture diagram generator. The format is detected from the apiVersion and kind fields, so there is nothing to select. Multi-document files separated by --- are read as one set of objects.
The generator then does three things:
- 1Groups objects by namespace. Each namespace becomes a boundary, and every object inside it is placed within that boundary. Objects whose metadata names no namespace are placed in
default, as the cluster would. - 2Derives edges from the way Kubernetes connects objects. A Service's
spec.selectoris matched against each workload's pod template labels. An Ingress rule'sbackend.service.nameis matched to the Service of that name in the same namespace. A HorizontalPodAutoscaler'sscaleTargetRefis matched to its Deployment or StatefulSet. PersistentVolumeClaims appear as storage nodes in their namespace with the capacity they request. Nothing is inferred from naming conventions; if the labels do not match, there is no edge, which is exactly what the cluster would do. - 3Reviews the architecture it drew. Each workload is checked for a single replica, a fixed replica count with no autoscaler, missing liveness and readiness probes, missing CPU and memory limits, mutable image tags such as
:latest, privileged containers, and host networking. Selecting a finding highlights the objects it refers to on the canvas.
The worked example
The tool ships a Kubernetes sample you can load with one click. It is a small storefront namespace with a web Deployment at three replicas behind a LoadBalancer Service and an Ingress, an api Deployment at one replica behind a ClusterIP Service, a postgres StatefulSet, and a HorizontalPodAutoscaler that scales web between three and ten replicas.
The generated diagram has one namespace boundary, seven objects, and four edges: Ingress to the web Service, each Service to its Deployment, and the autoscaler to web. It also raises five findings, all medium: the api Deployment runs a single replica, uses the mutable tag api:latest, and, along with postgres, defines no probes and no resource limits. The sample is deliberately imperfect so there is something to read. You can download the generated SVG, the sample manifests, and the findings as JSON from the tool page.
What the diagram cannot show
A diagram generated from manifests is a faithful picture of the objects in the file. It is not a picture of the running system, and it is worth being precise about the gap.
- Pod-to-pod traffic. Kubernetes does not declare which workload calls which. An edge from a Service to a workload means "this Service routes to these pods", not "something is calling it". Observed traffic needs a service mesh or network flow logs.
- NetworkPolicy effects. Policies restrict traffic but do not create connections, so they appear as objects rather than as edges. Whether
apican reachpostgresdepends on policy evaluation the diagram does not perform.
- Resources outside the manifests. A managed database, an object store, a cloud load balancer created by an Ingress controller, or anything created in a console rather than in YAML will not appear. For those, the diagram needs to come from the cloud account, not the cluster; that is what read-only discovery is for.
- Multi-cluster topology. One file is one cluster. Federation, cross-cluster Services and global load balancers need a diagram of the layer above.
Treat the generated diagram as the authoritative view of what the manifests declare, and annotate anything beyond that explicitly.
Ways to produce a Kubernetes diagram, compared
| Approach | Examples | Source of truth | Stays current | Best for |
|---|---|---|---|---|
| Draw it by hand | draw.io, Lucidchart with Kubernetes icon sets | The author's memory | Only when someone edits it | Proposed designs, slides, annotations |
| Diagram as code | Mermaid, the Python diagrams library | A second description you maintain | When the code is updated | Documentation that lives in Git |
| Generate from manifests | ops0 diagram generator, KubeDiagrams | The manifests themselves | Every time you regenerate | Reviews, onboarding, pull requests |
| Generate from a live cluster | Kubeview, Lens, kube-ops-view | The API server | Live | Operations, incident response |
The approaches are not exclusive. Many teams keep a hand-drawn diagram for the intended design, generate one from manifests in each pull request that touches the chart, and use a live view during incidents. The failure mode to avoid is a single hand-drawn diagram standing in for all three, which is how infrastructure diagrams end up wrong a few weeks after they are drawn.
Keeping the diagram in the review loop
Because generation takes a minute and the input is already in Git, the diagram can become part of a pull request rather than a separate artefact. A practical pattern:
- Render the chart or overlay for the target environment with
helm templateorkubectl kustomize.
- Generate the diagram and export it as SVG for the pull request description, or as Mermaid if your repository host renders it inline.
- Read the findings. A new single-replica Deployment or a
:latesttag introduced by the change is visible before it merges, not after it pages someone.
- After deploy, export the live namespace with
kubectl get -o yamland generate again. If the two diagrams differ, something was applied outside the chart.
For clusters where the manifests are only part of the story, ops0 connects the Kubernetes view to the cloud resources around it. Kubernetes in ops0 reads workloads, events and incidents alongside the VPCs, databases and IAM roles they depend on, so the diagram of a namespace and the diagram of the account it runs in are the same graph.
How do I get a Kubernetes architecture diagram from an existing cluster?
Export the objects for one namespace with kubectl get deployment,statefulset,daemonset,service,ingress,horizontalpodautoscaler,persistentvolumeclaim -n <namespace> -o yaml, then paste the file into a generator that reads Kubernetes manifests. The command is read-only, and the diagram reflects what is running rather than what the chart intended.
Can I generate a diagram from a Helm chart without installing it?
Yes. helm template <release> <chart> -f <values> renders the chart to plain manifests on your machine without contacting a cluster. Paste the output into the generator to diagram exactly what that values file would deploy.
How are the connections in the diagram decided?
From the manifests, the same way Kubernetes decides them. A Service's spec.selector is matched against workload pod labels, an Ingress backend names its Service, and a HorizontalPodAutoscaler names its scaleTargetRef. No connections are guessed from object names.
Does a Kubernetes diagram from YAML show real traffic between pods?
No. Kubernetes manifests do not declare which workload calls which, so a manifest-based diagram shows routing (Service to pods) and references, not observed requests. Traffic between pods needs a service mesh, eBPF tooling or flow logs.
Is it safe to paste production manifests into an online generator?
Only if the tool runs entirely in the browser. The ops0 generator parses and draws locally and sends nothing to a server, which you can confirm in the browser's Network tab. Manifests can still contain secrets in environment variables or ConfigMaps, so strip those before sharing the file itself.
- Service: Kubernetes documentation. Services select pods by label and route traffic to them.
- Ingress: Kubernetes documentation. Ingress rules reference backend Services by name.
- Horizontal Pod Autoscaling: Kubernetes documentation. scaleTargetRef names the workload an autoscaler controls.
- kubectl get: Kubernetes documentation. Exporting multiple resource kinds as YAML from a namespace.
- Helm Template: Helm documentation. Rendering a chart to manifests locally without installing it.